
What Makes a Good Job? Only 4 in 10 U.S. Workers Have One



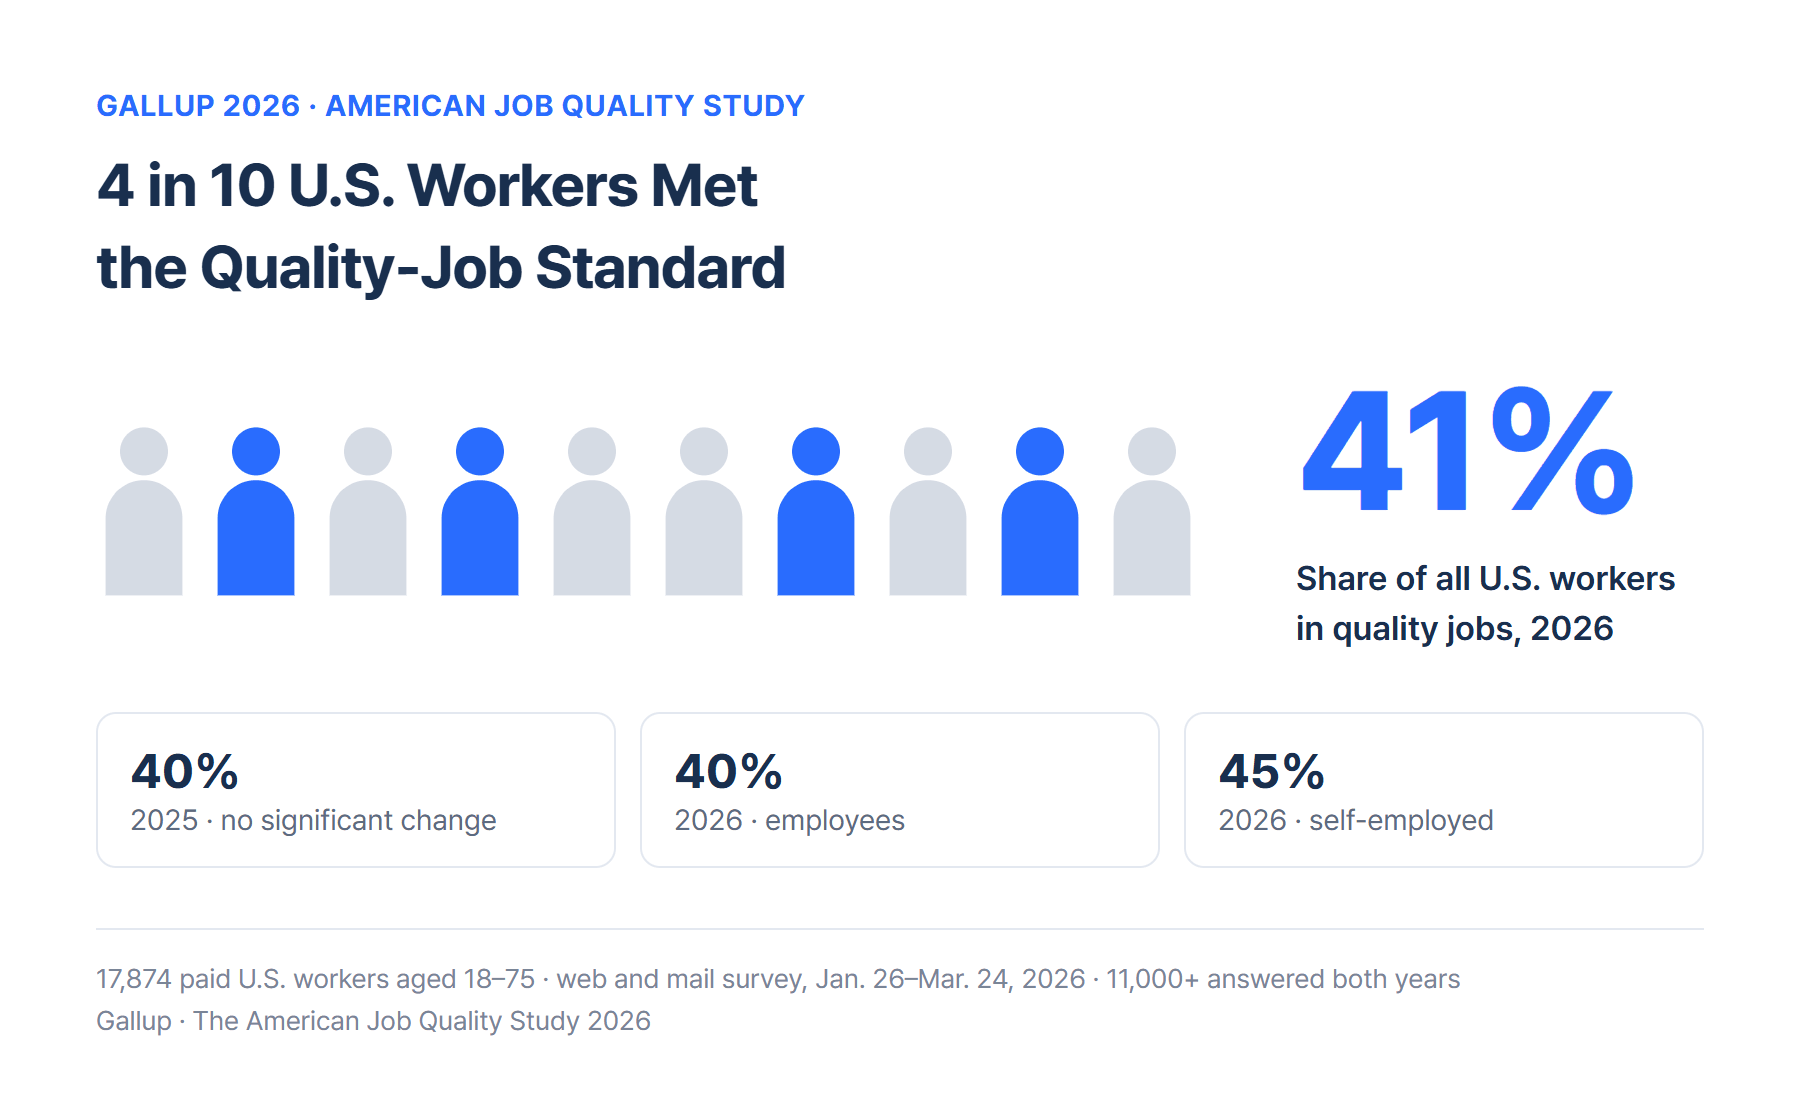
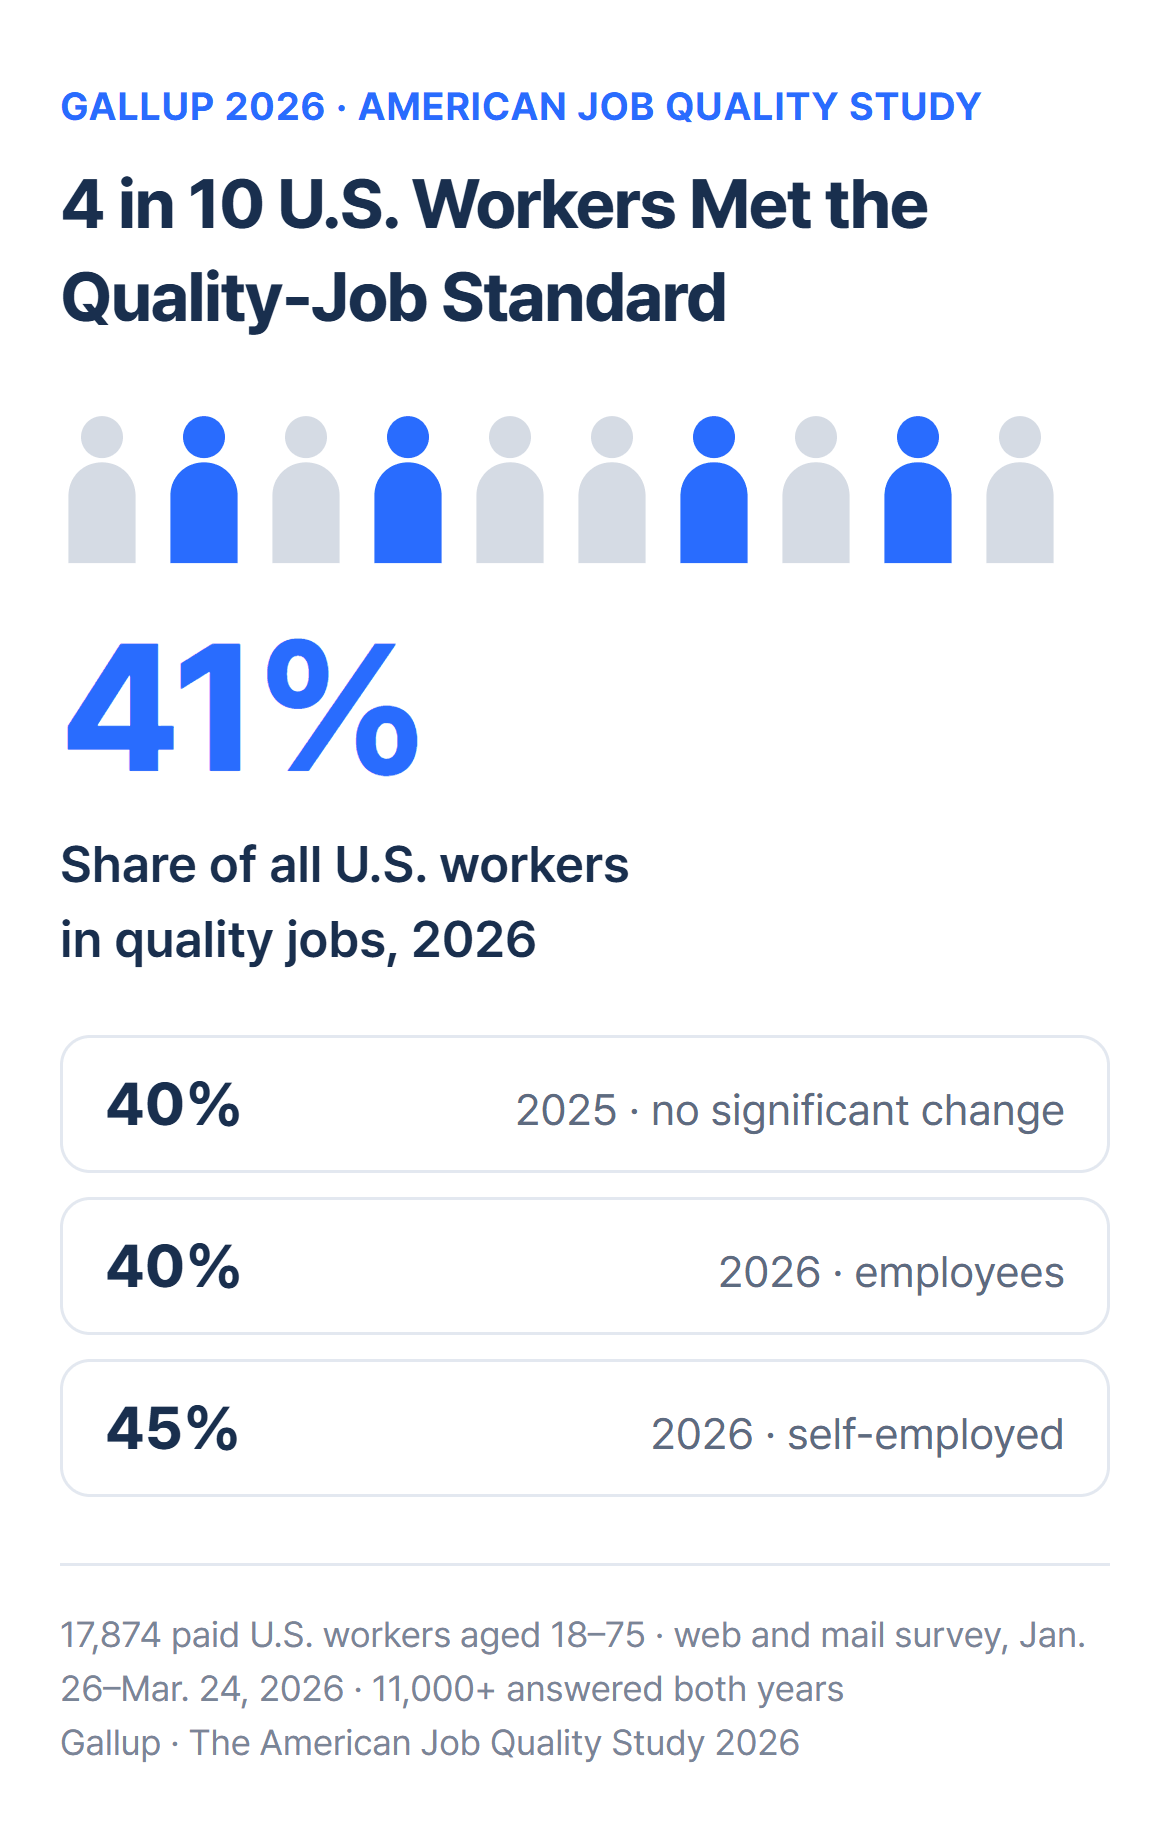
Pay alone doesn’t tell you whether a job is a good one. Gallup looked at five things together: fair pay and job security, a safe and respectful workplace, opportunities to grow, a say in decisions that shape your job, and a schedule and workload you can predict and manage. When Gallup applied these criteria to 17,874 U.S. workers in 2026, 41% were in what it calls a quality job.
The finding comes from the 2026 report of the American Job Quality Study, which Gallup runs with Jobs for the Future and The Families and Workers Fund. The researchers argue that traditional indicators such as unemployment and average wages say little about what a worker’s day actually looks like, so they set out to measure job quality directly. In its second year, the study also examined how job quality relates to turnover, health, and missed work.
How Gallup Surveyed 17,874 U.S. Workers
The survey ran from January 26 to March 24, 2026. It covered 17,874 U.S. adults aged 18 to 75 who had worked for pay in the previous seven days. Alongside 15,482 people employed by an organization, it included self-employed, gig, and other independent workers. Respondents were drawn from the probability-based Gallup Panel and a separate address-based sample, and they answered by web or mail. Results were weighted to match the U.S. working population on gender, age, race, ethnicity, education, and region.
The study began in 2025. More than 17,000 workers took part in each year, and more than 11,000 answered both surveys. That overlap let the researchers follow how the same person’s job changed over a year, including whether they left their employer.
The 5 Criteria of a Good Job
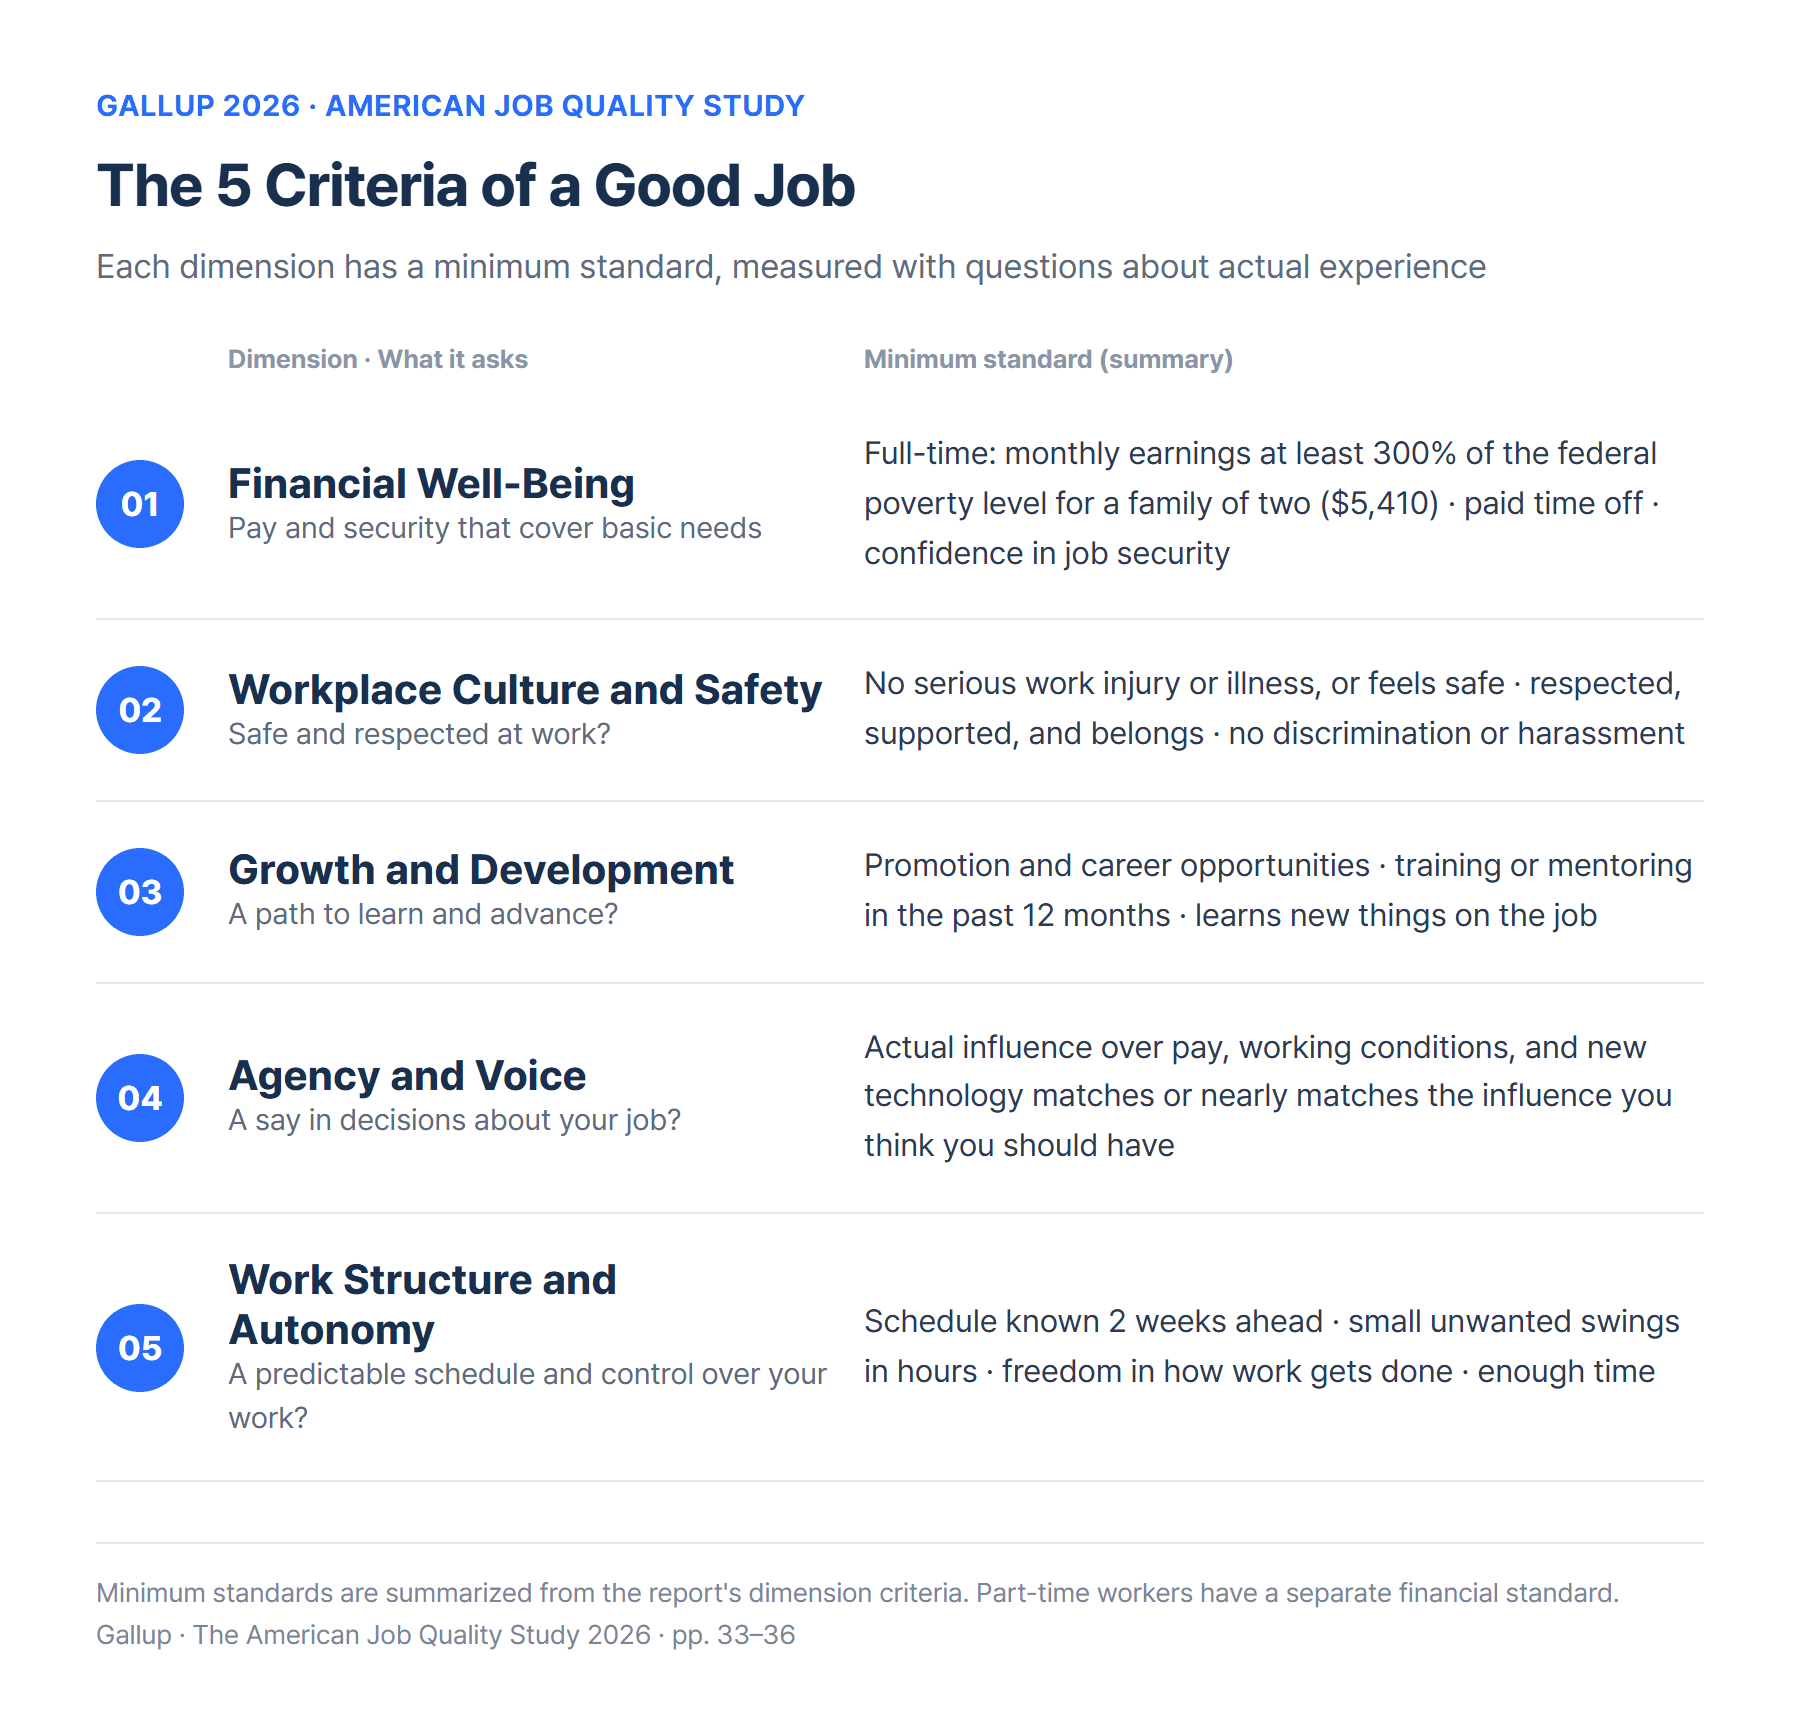
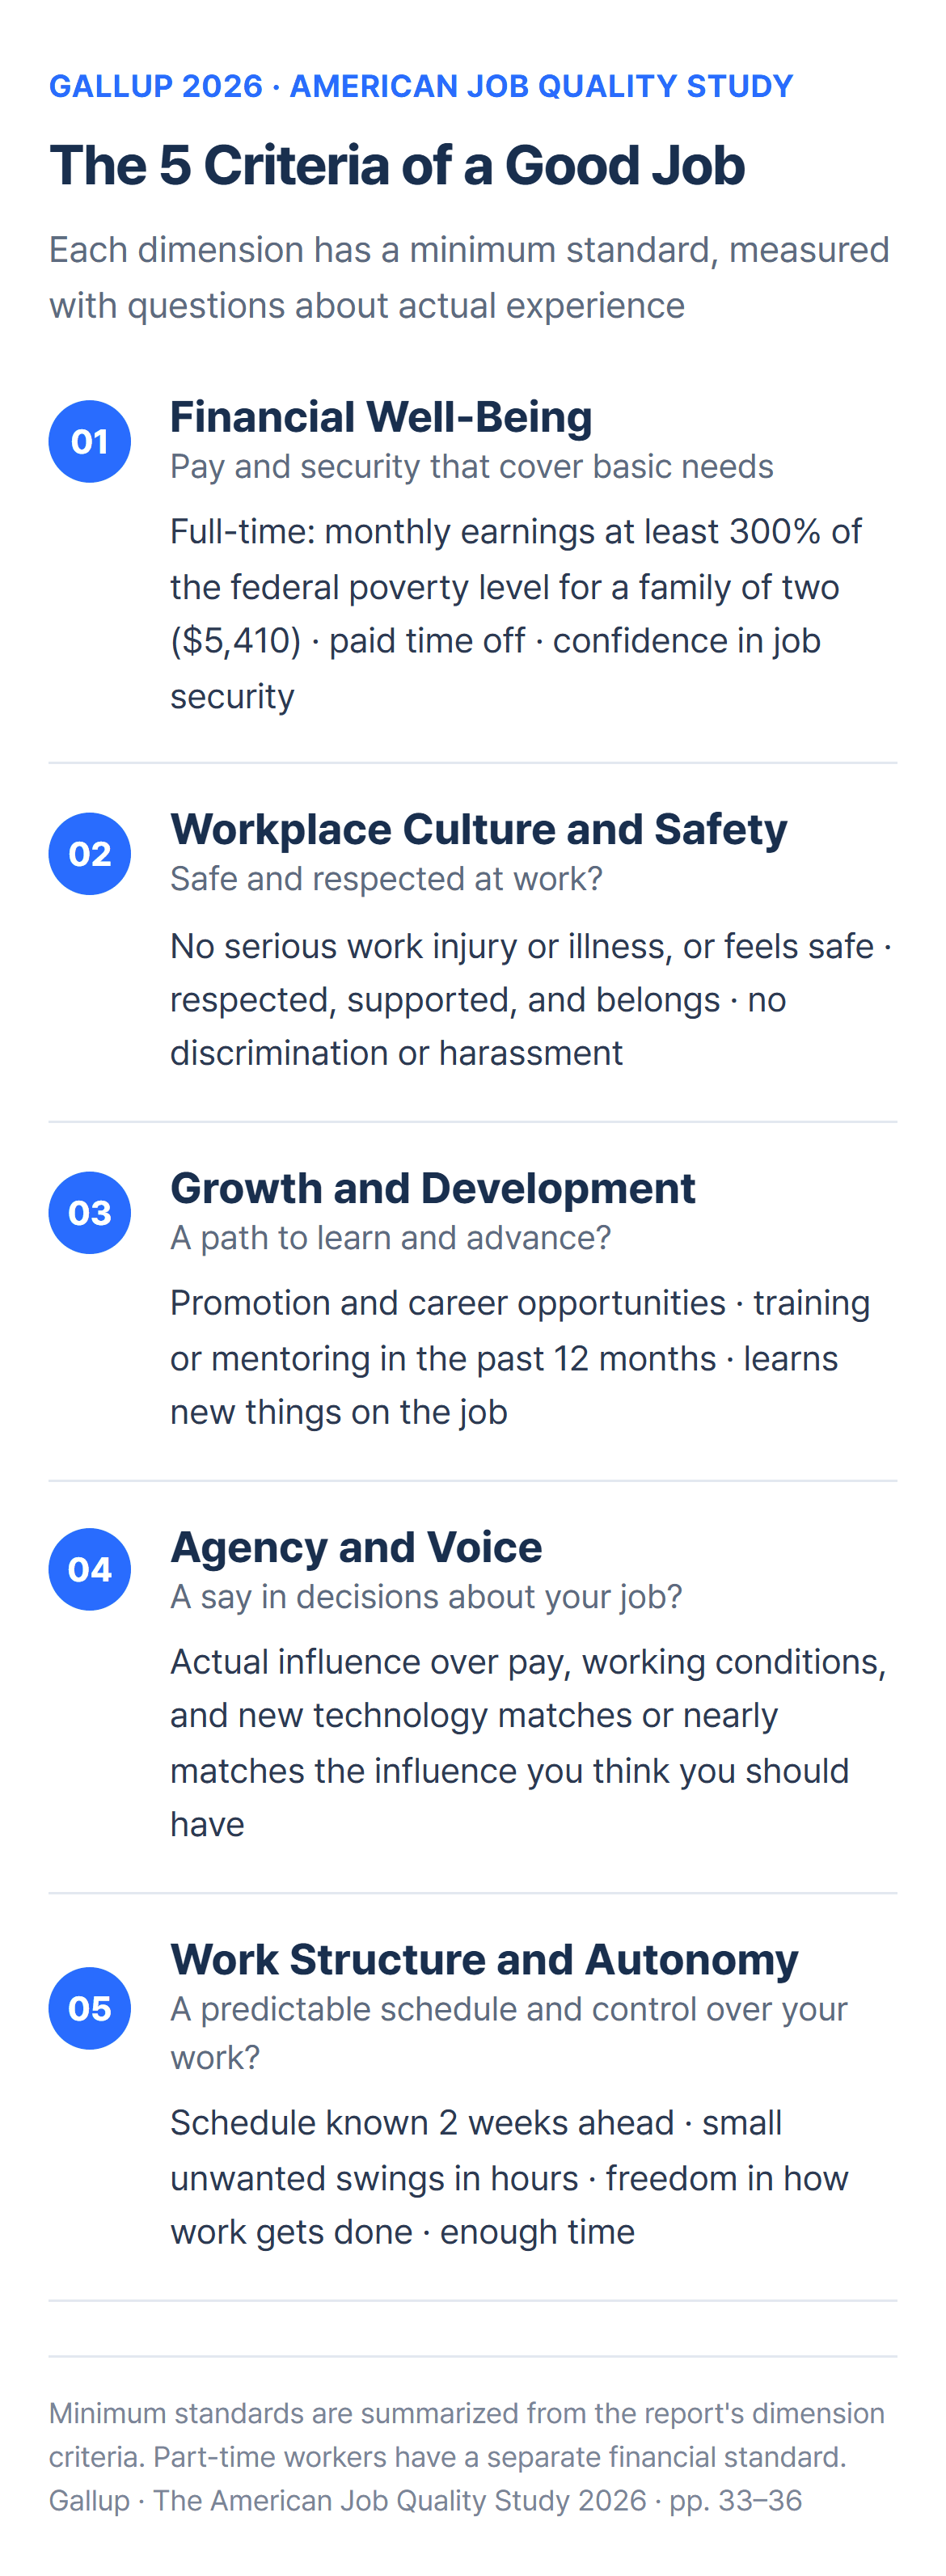
The researchers split job quality into five dimensions and set a minimum standard for each one using specific survey questions. Instead of asking once whether people were satisfied with their jobs, they asked about things respondents had actually experienced.
1. Financial Well-Being: Pay and Security That Cover Basic Needs
Full-time workers need monthly earnings of at least 300% of the federal poverty level for a family of two, or $5,410 a month. Employees need access to some form of paid time off, and they need to be confident they can stay in their role as long as their performance is adequate and the economy holds steady. Part-time workers can meet the standard even below that income line if they report no financial distress and don’t need more hours or a second job to get by.
2. Workplace Culture and Safety: Safe and Respected at Work
This dimension looks at whether workers avoided a serious work-related injury or illness in the past year and feel physically safe at work. Those who were injured can still meet it if they strongly agree that they feel safe. It also asks whether people feel supported, respected, and that they belong. Workers who report discrimination based on race, gender, age, appearance, disability, or similar factors, or who were bullied, threatened, or harassed by a supervisor, coworker, or customer, will struggle to clear this bar.
3. Growth and Development: A Path to Learn and Advance
The study asks whether the organization offers promotion and career opportunities, whether the worker took part in training or mentoring in the past 12 months, and whether the job lets them learn new things.
4. Agency and Voice: A Say in Decisions About Your Job
Workers are asked, separately, how much influence they or their coworkers actually have over three areas, and how much they think they should have: pay and benefits, working conditions, and the adoption of new technology such as software, AI tools, or robotics. The standard is met when actual influence matches or nearly matches the influence people believe they should have. In other words, the study measures the gap with expectations, not the absolute amount of influence.
5. Work Structure and Autonomy: A Predictable Schedule and Control Over Your Work
Unless they set their own hours, workers need to know their schedule at least two weeks in advance. Their hours shouldn’t swing much against their will (for example, by more than 25% from week to week), and they need some input into when and how much they work. The study also asks whether people have freedom in how they do their work, enough time to get everything done, and whether the job requires them to work very fast.
How Gallup Calculated the 41%
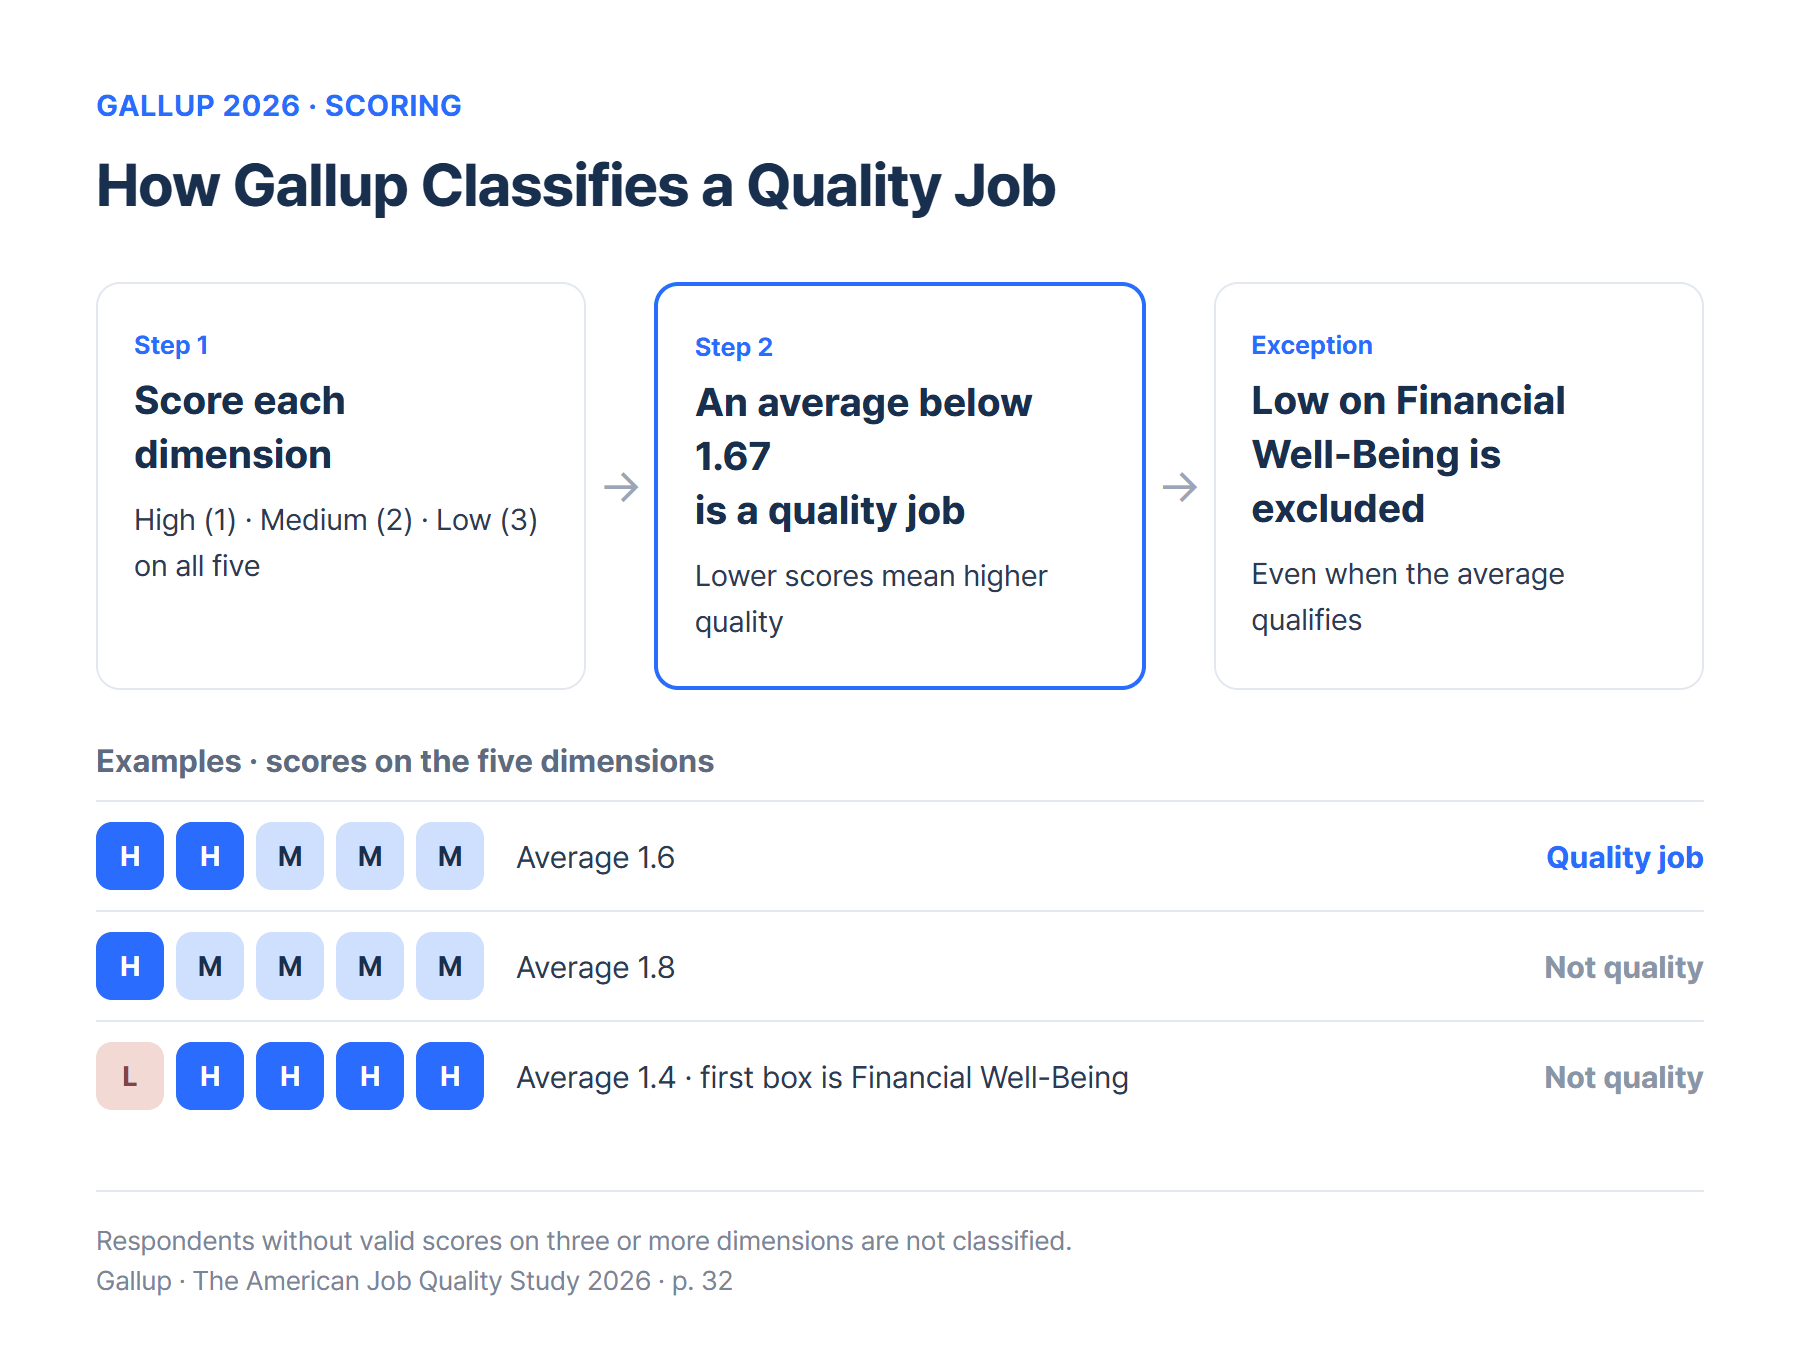
Each respondent gets a score of High (1), Medium (2), or Low (3) on each of the five dimensions. If the average of the five scores is below 1.67, the job counts as a quality job; otherwise it doesn’t. Because lower is better, a worker with two Highs and three Mediums averages 1.6 and qualifies, while a worker with one High and four Mediums averages 1.8 and does not.
There is one exception. A job that qualifies on average is still classified as non-quality if it scores Low on Financial Well-Being, because the researchers treat economic stability as fundamental to job quality. So the 41% is not the share of people who meet all five conditions perfectly. It is the share whose combined score clears the bar and whose financial footing is secure.
Two Years in a Row, About 4 in 10 Have a Quality Job
In 2026, 41% of all U.S. workers met the study’s standard, statistically unchanged from 40% in 2025. The researchers say the two years of data are starting to form a national baseline, and that quality jobs in America remain the exception rather than the norm. Among employees the rate was 40%; among the self-employed, 45%.
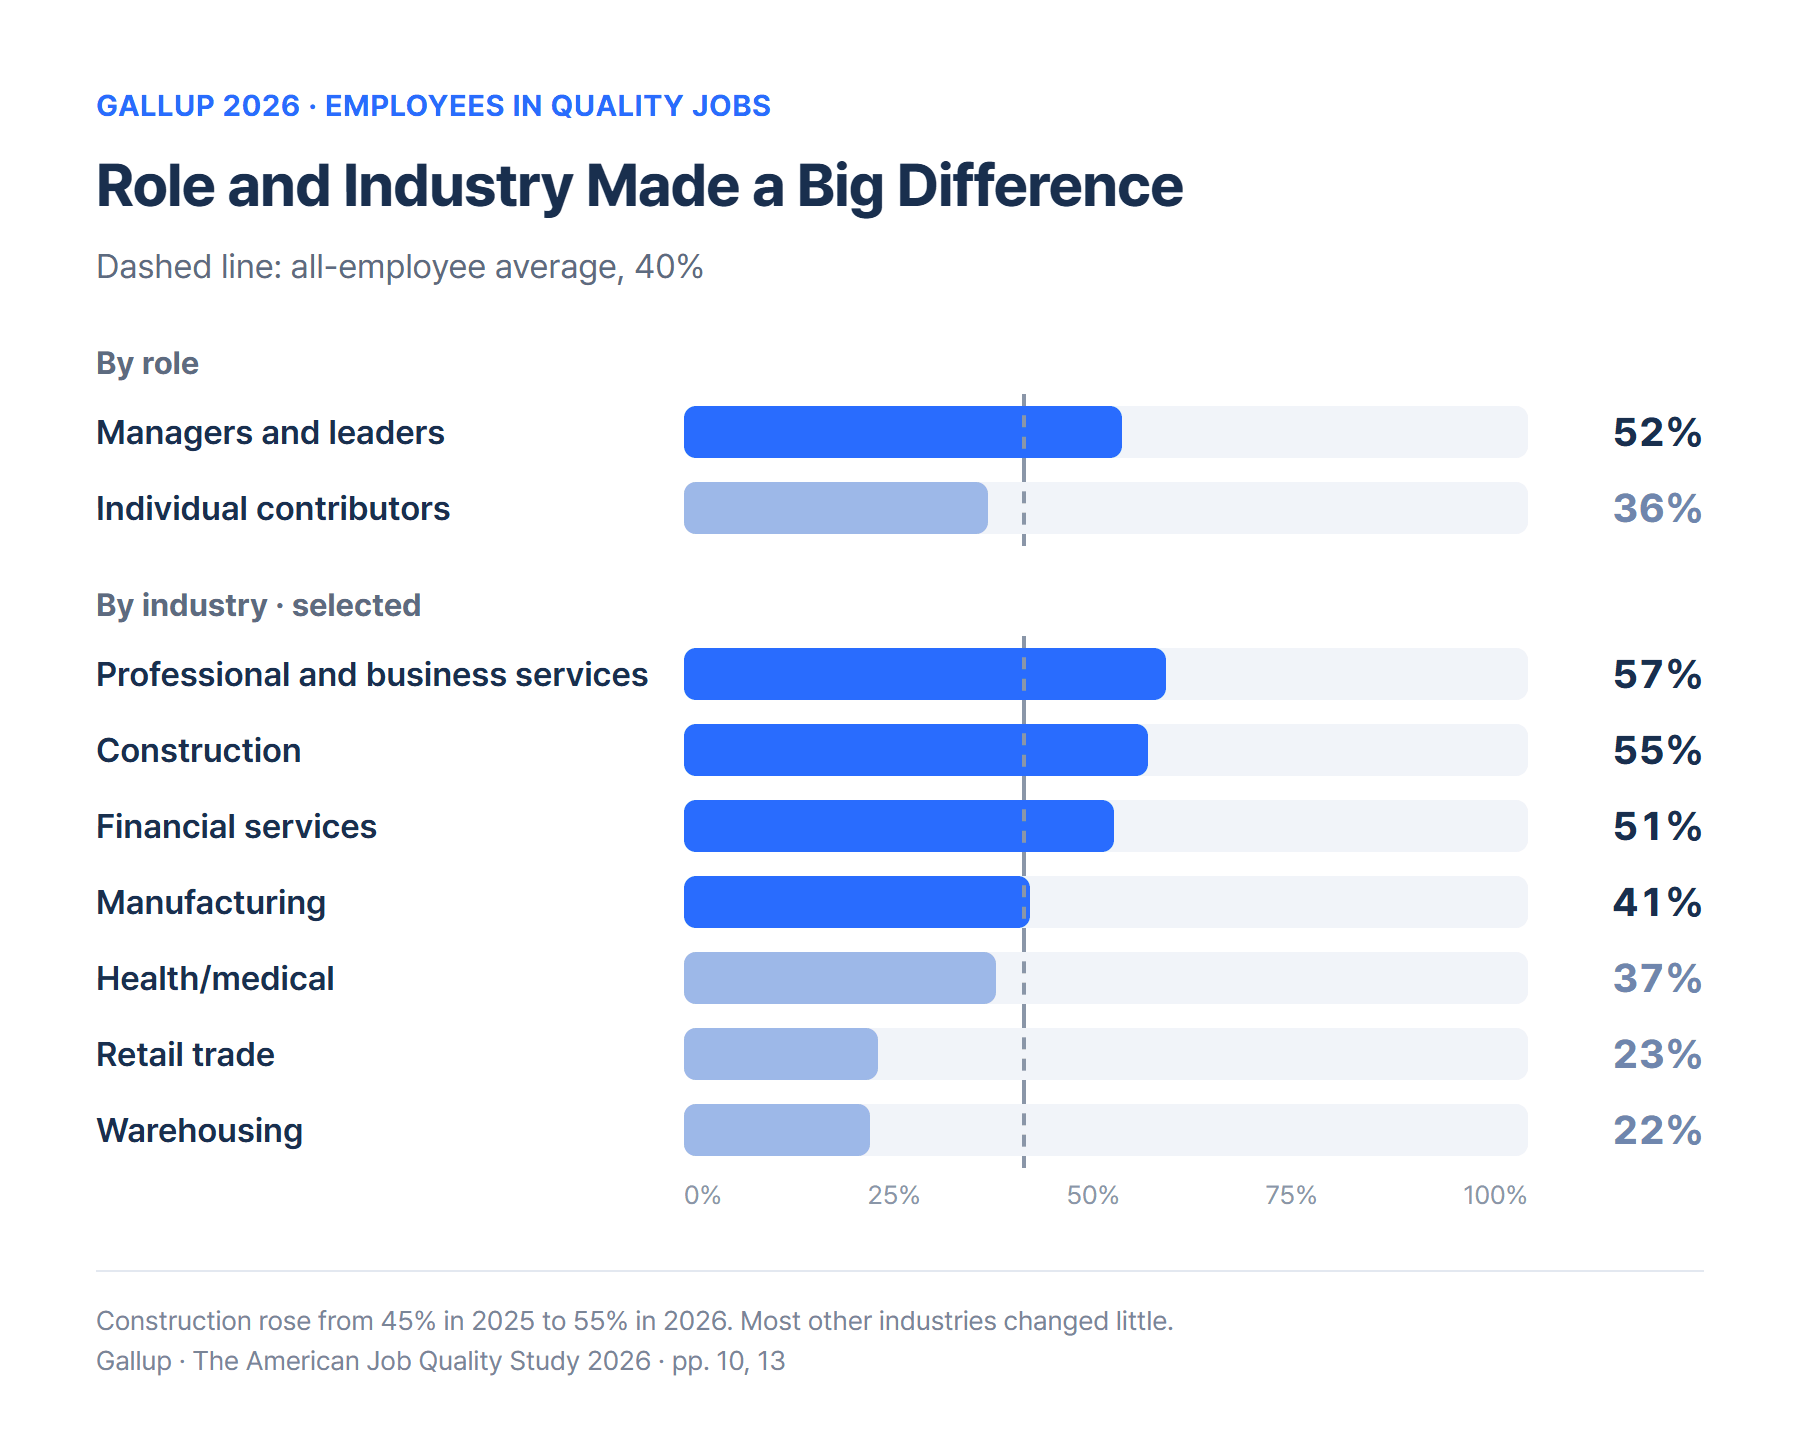
Role made a big difference. Measured for the first time in 2026, 52% of managers and leaders had quality jobs, compared with 36% of individual contributors. The researchers call this one of the largest gaps in the study.
By industry, professional and business services ranked highest at 57%, while warehousing (22%) and retail (23%) ranked lowest. Most industries looked much like they did in 2025, but construction stood out, rising from 45% to 55%. Scores improved on all five dimensions there, with the biggest gain in growth and development. Among Gen Z employees aged 18 to 29, only 32% had quality jobs.
Employees in Quality Jobs Were Less Likely to Leave
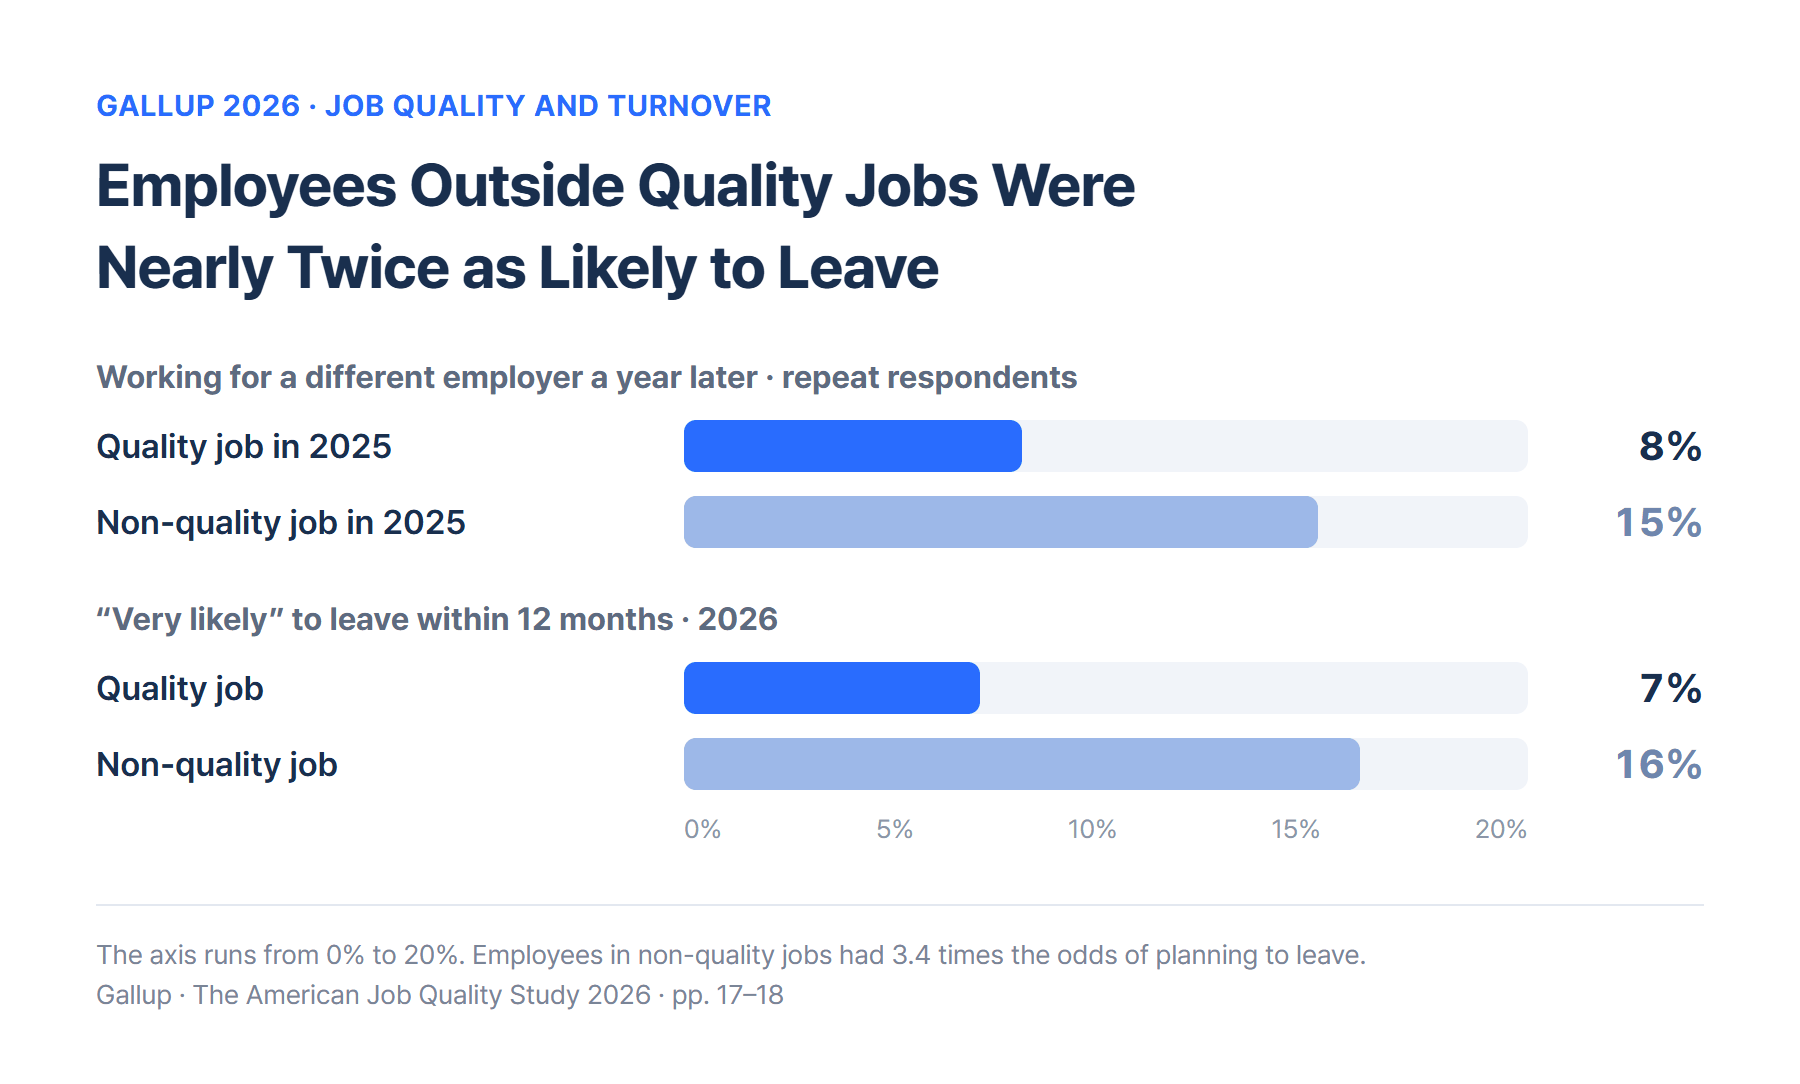
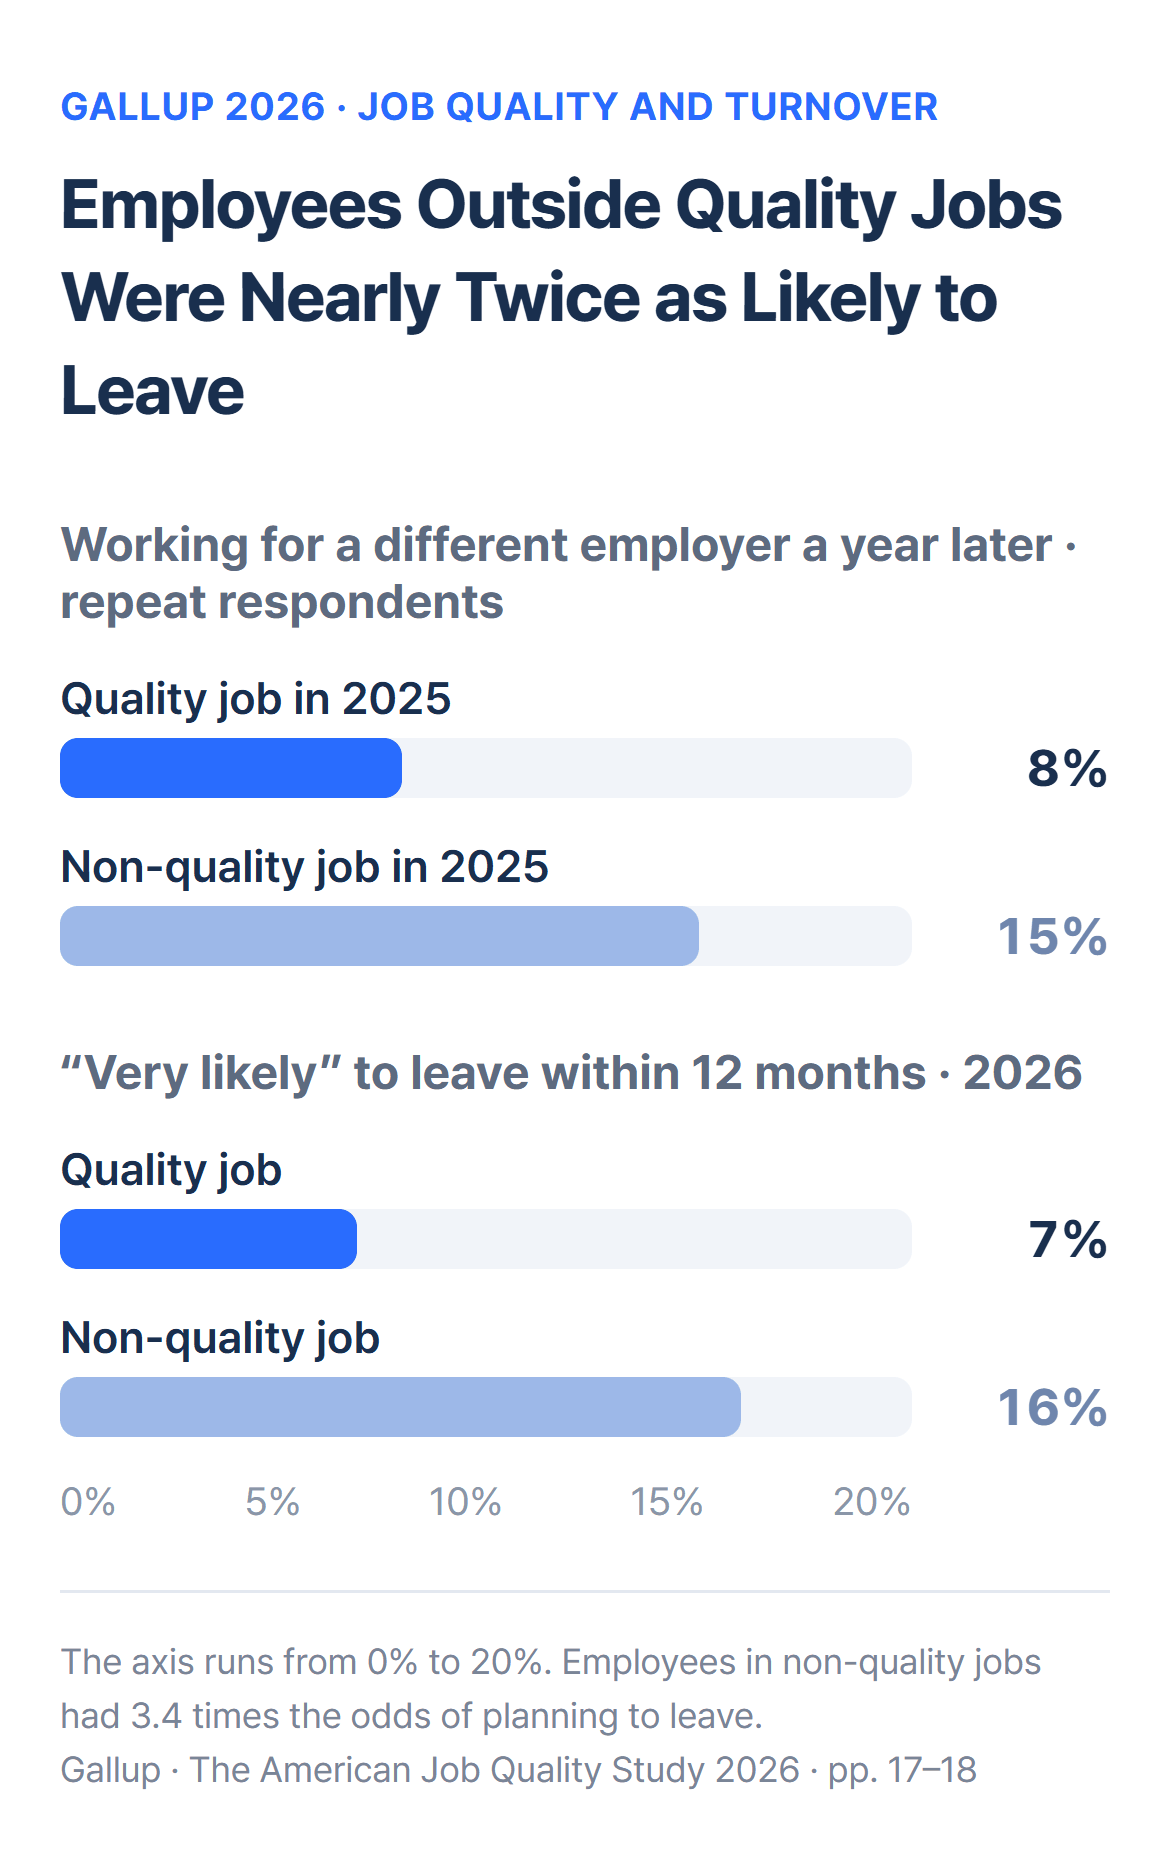
Comparing employees who answered both surveys showed a clear gap. Of those who were in non-quality jobs in 2025, 15% were working for a different employer a year later. Among those in quality jobs, the figure was 8%, nearly half as many.
Future plans followed the same pattern. Sixteen percent of employees in non-quality jobs said they were very likely to leave their current job within the next 12 months, compared with 7% of those in quality jobs. Statistically, employees in non-quality jobs had 3.4 times the odds of planning to leave.
Respect and Safety Were Most Strongly Linked to Plans to Leave
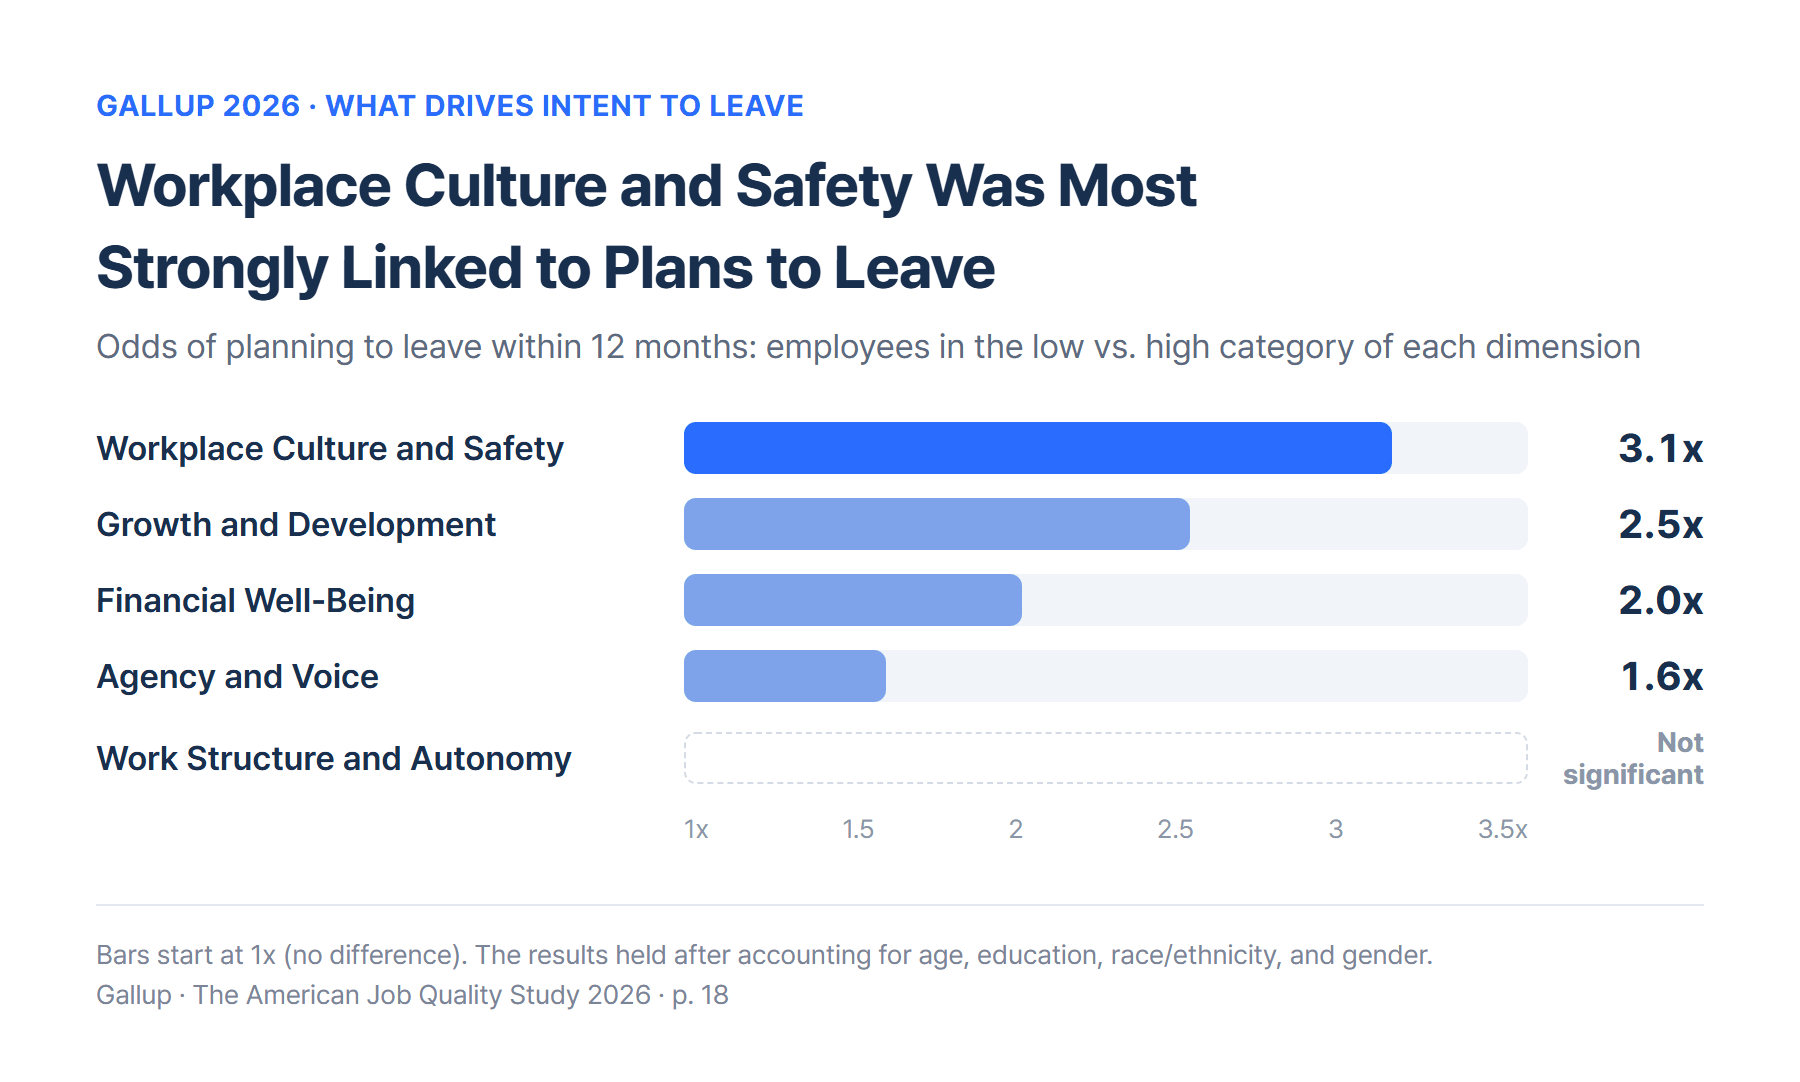
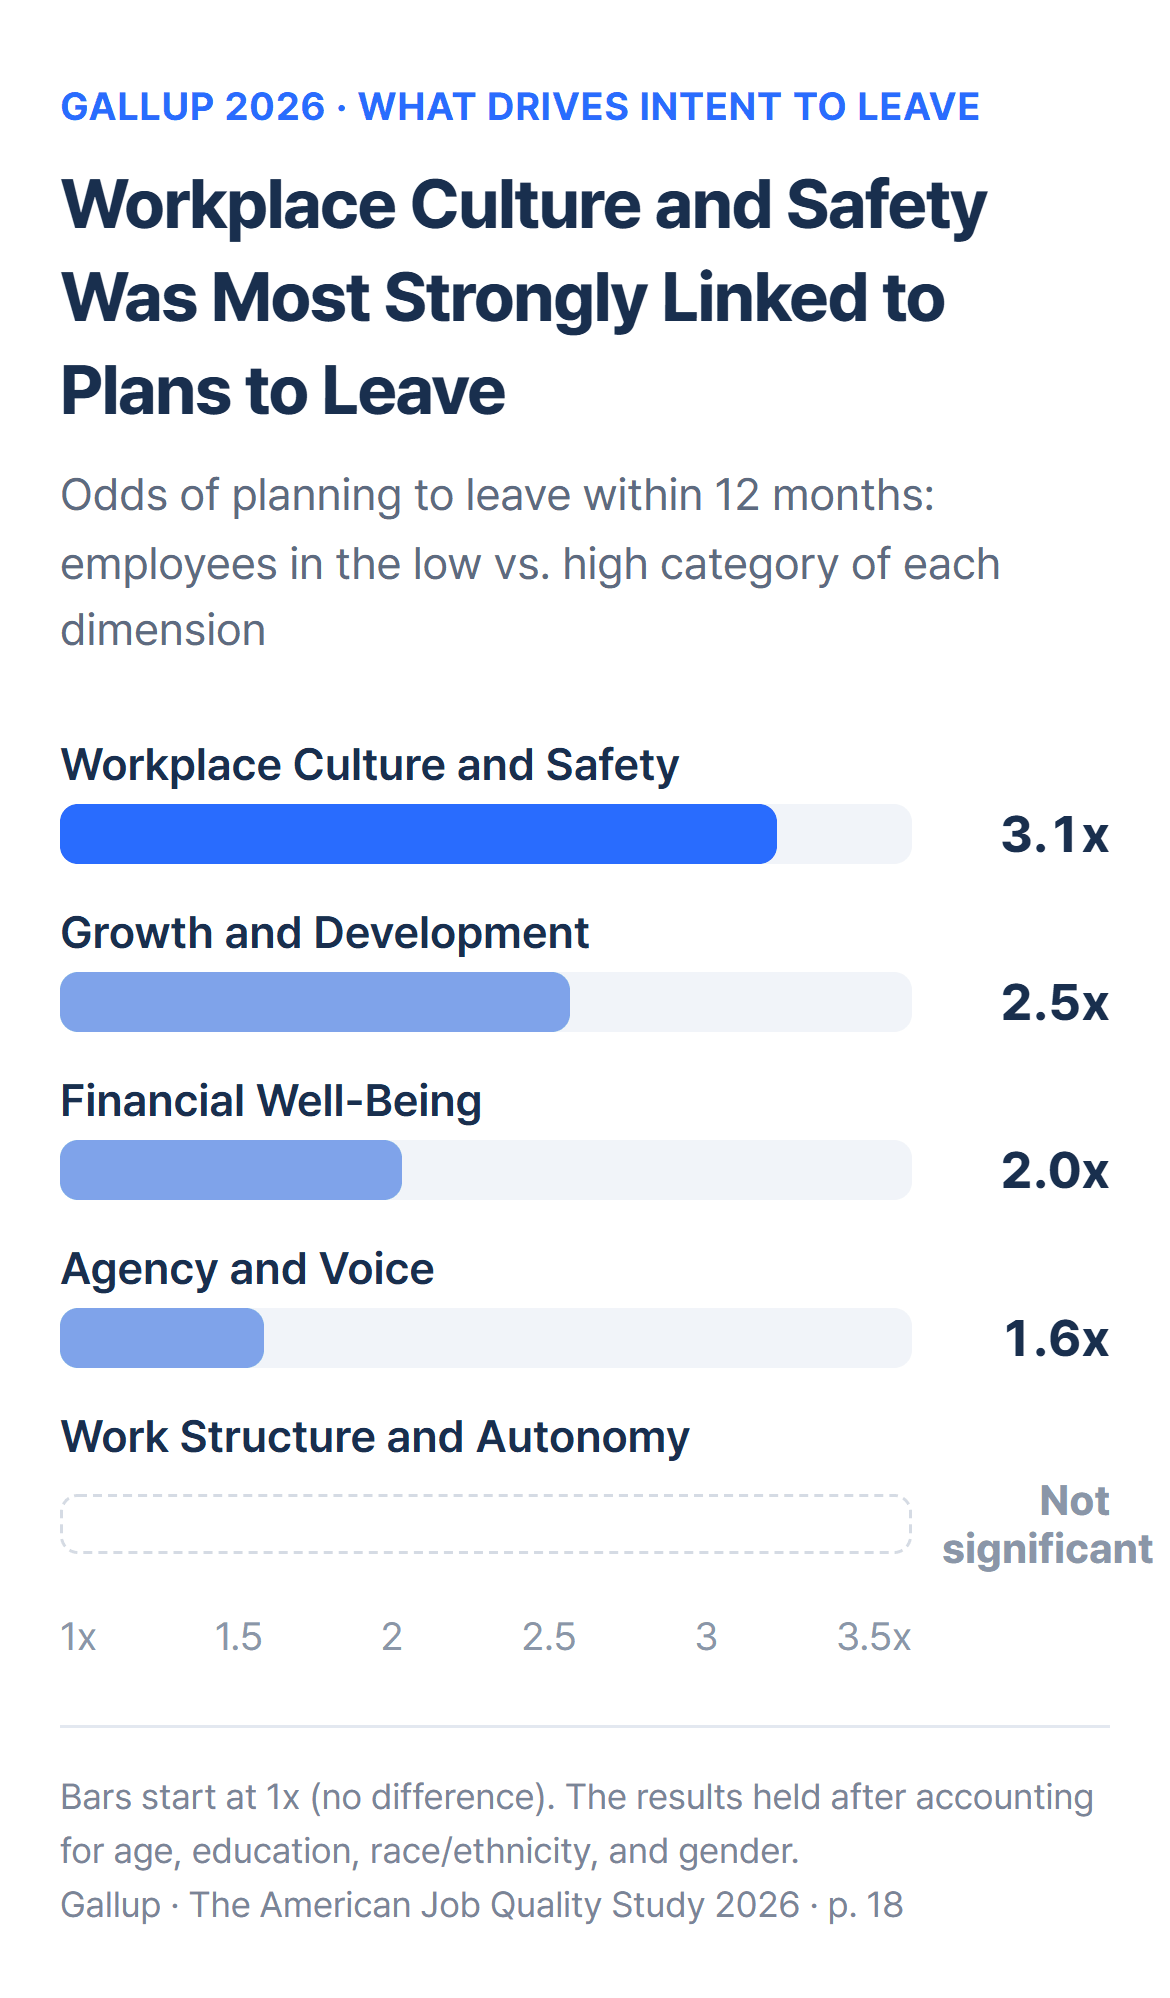
The researchers also looked at which of the five dimensions predicted intent to leave. Comparing employees in the low and high categories of each dimension, the odds of planning to leave were 3.1 times higher for Workplace Culture and Safety, the widest gap. Growth and Development followed at 2.5 times, Financial Well-Being at 2.0 times, and Agency and Voice at 1.6 times. Work Structure and Autonomy showed no significant relationship. These links held after accounting for age, education, race and ethnicity, and gender.
A direct question about respect pointed the same way. Among employees who strongly disagreed that they are treated with respect at work, 32% said they were very likely to leave within a year. Among those who strongly agreed, 9% did.
One in Four Employees Reported Discrimination or Unfair Treatment
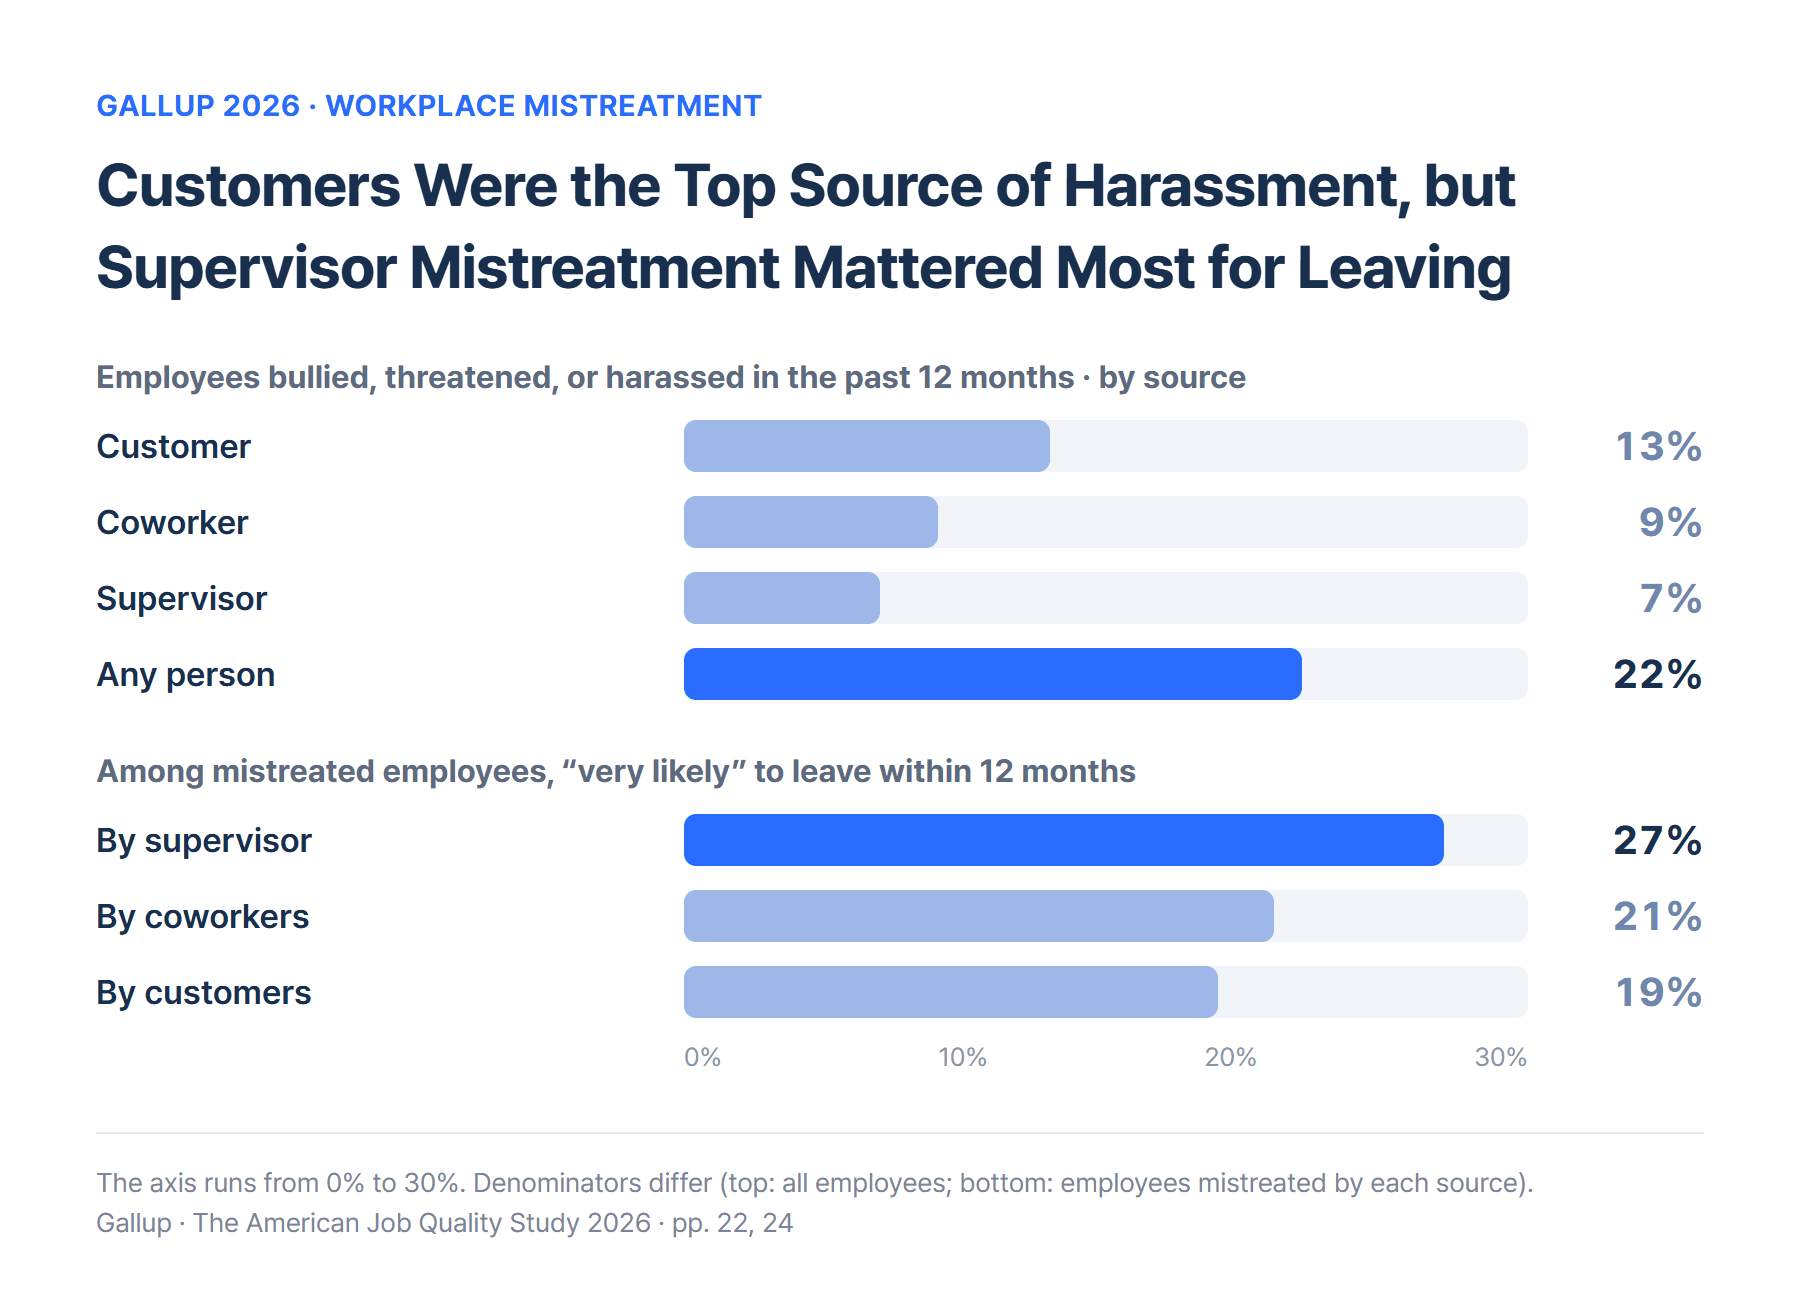
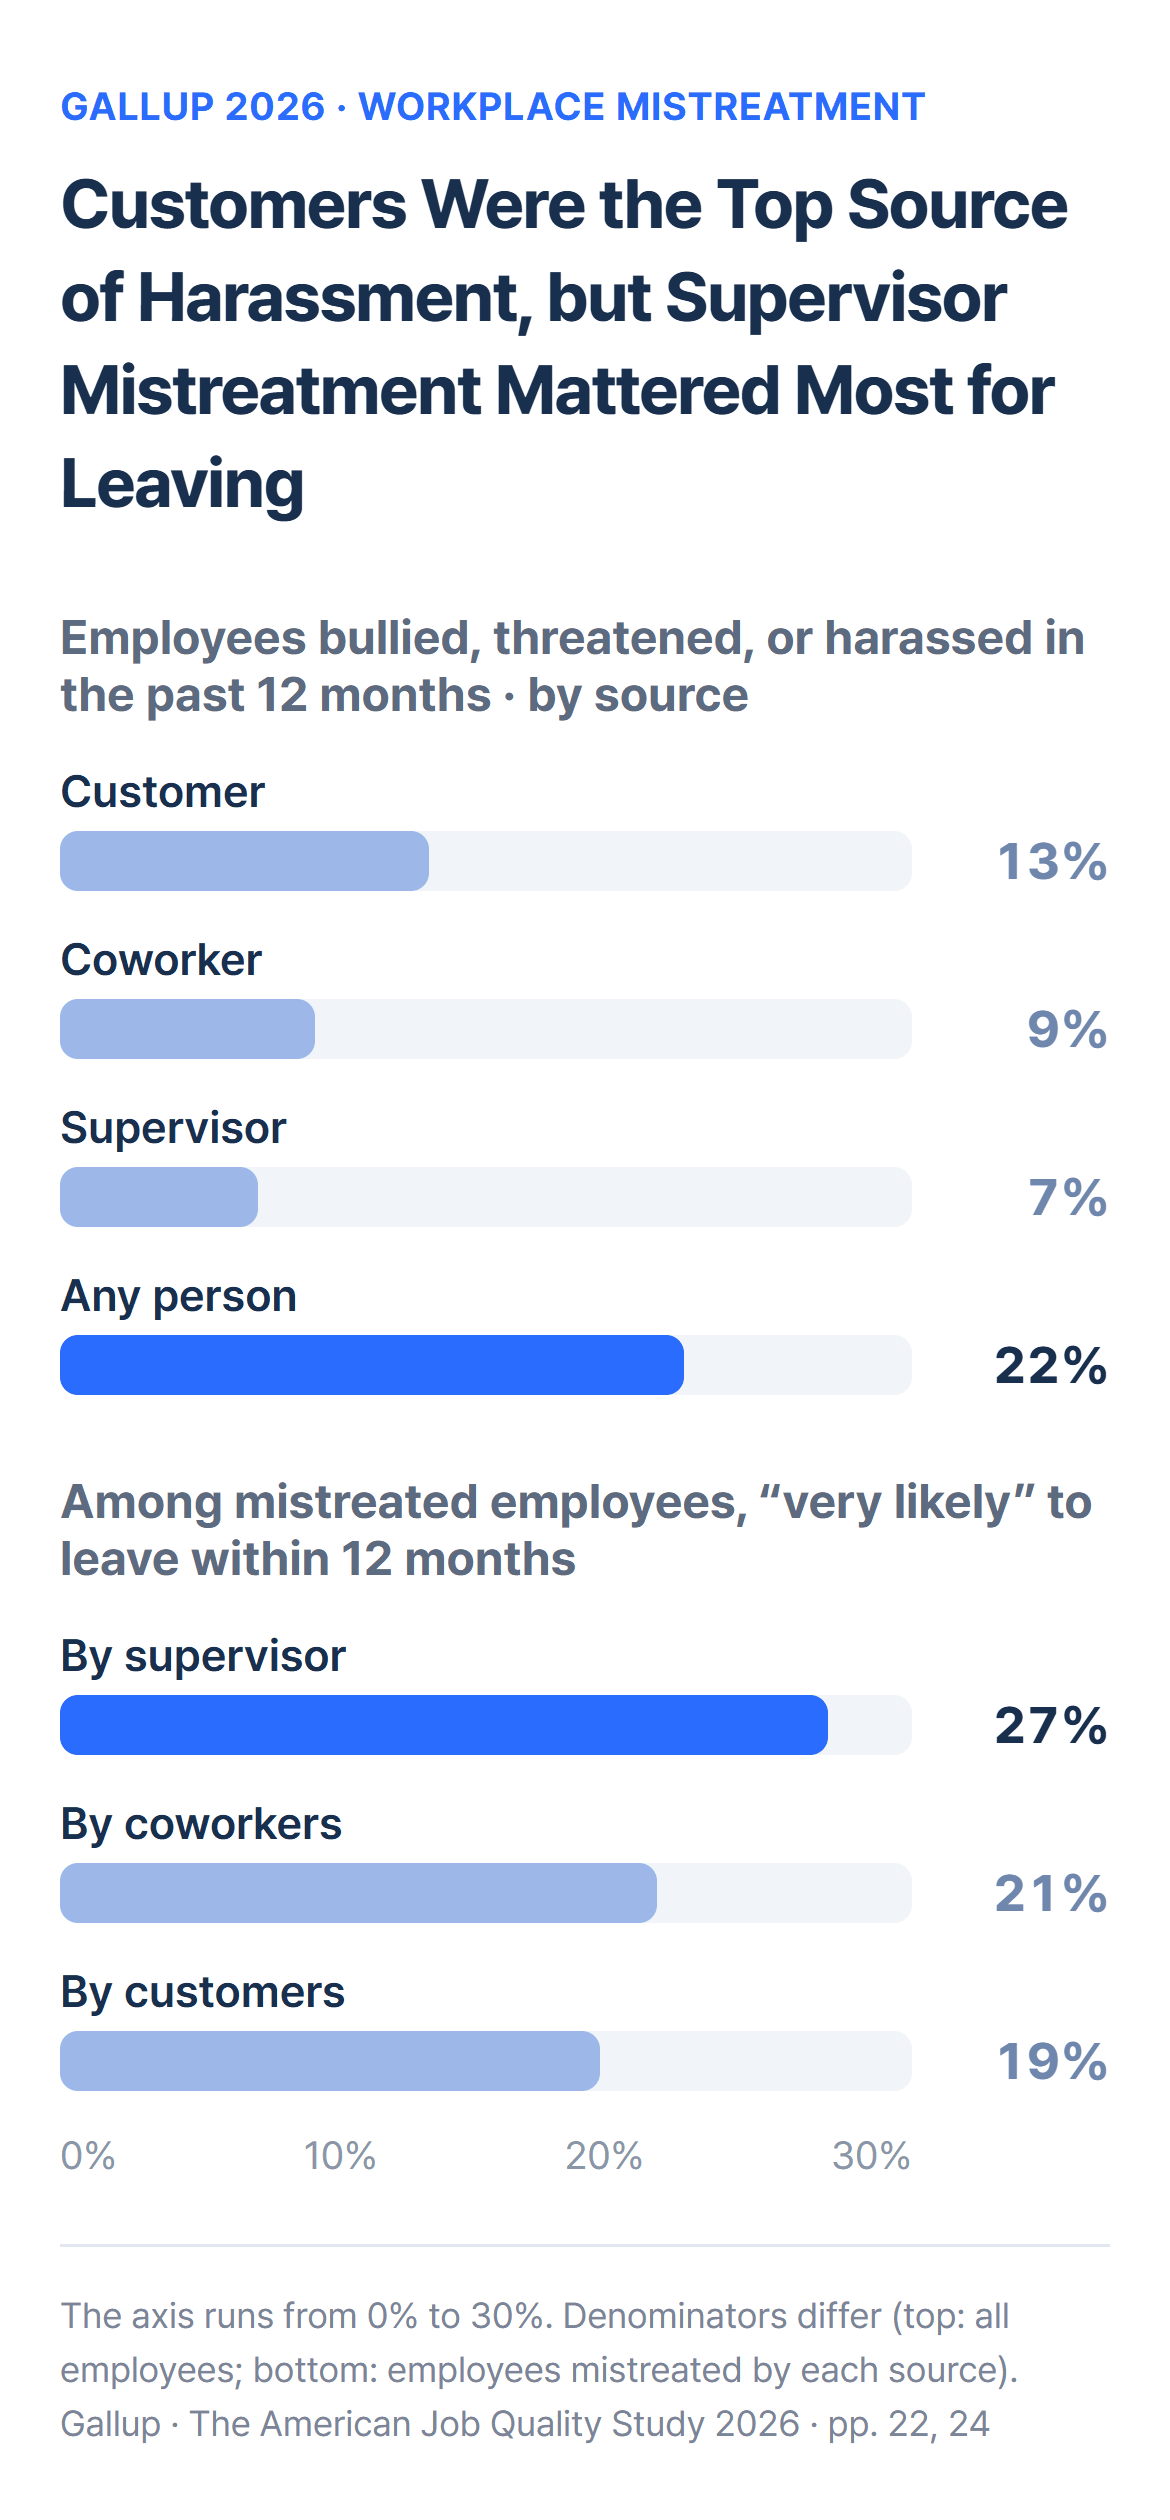
The details behind Workplace Culture and Safety are sobering. A quarter of U.S. employees (25%) said they had been discriminated against or treated unfairly at work because of factors such as age, race, sexual orientation, or disability, and 22% said they had been bullied, threatened, or harassed by a supervisor, coworker, or customer. Customers (13%) were cited more often than coworkers (9%) or supervisors (7%). Sixty-two percent reported none of the forms of mistreatment the study measured.
When it came to leaving, though, supervisors mattered most. Among employees mistreated by a supervisor, 27% said they were very likely to leave within a year, compared with 21% of those mistreated by coworkers and 19% of those mistreated by customers. The researchers suggest that how managers treat employees may be especially consequential for retention.
Satisfaction, Health, and Missed Work Also Differed
Fifty-nine percent of employees in quality jobs said they were highly satisfied with their jobs (8 to 10 on a 10-point scale), compared with 24% of those in non-quality jobs. The share rating their own health as excellent or very good was 51% versus 35%.
By combining these answers with the 2023 Medical Expenditure Panel Survey (MEPS), the researchers also estimated costs that employers feel. Employees in quality jobs miss an average of four workdays a year to illness or injury, one fewer than those in non-quality jobs (five). Their annual private-insurance healthcare spending was estimated at about $5,200 versus $6,200, or 16% lower. The researchers note that the data show an association between job quality and health, not which one causes the other.
Frequent AI Users Were Already More Likely to Have Quality Jobs
This year’s survey added questions about AI for the first time. Twenty-eight percent of U.S. employees used AI at work at least weekly (13% daily and 15% weekly), while 54% said they had never used it in their role. Among weekly users, 52% had quality jobs, compared with 32% of those who never used AI. The researchers caution that this does not mean AI made those jobs better. Frequent AI use is concentrated among managers and more highly educated employees, groups that were already more likely to hold quality jobs. Fifty-five percent of employees also said they have less influence over the adoption of new technology than they would like.
What This Means for Companies Rethinking a “Good Workplace”
In Korea, too, people don’t define a good workplace by salary alone. In a Saramin survey reported in July 2024, the most common description among 3,365 job seekers and employees was a workplace that protects work-life balance (60.9%, multiple answers allowed), followed by strong financial rewards (52.7%) and low stress from relationships with bosses and coworkers (40.1%). Those answers overlap heavily with Gallup’s five criteria.
What the Gallup study adds is less a list of criteria than a view of who actually experiences them. Among U.S. employees, 52% of managers and leaders had quality jobs, but only 36% of individual contributors. Within a single company, how predictable the schedule is, whether there is room to grow, and how much people take part in decisions can differ by role and team. That is why it’s worth setting the conditions a company says it offers, such as average pay and benefits, side by side with the conditions employees experience day to day.

The study’s method is worth borrowing as well. Gallup asked about experiences that can be checked: whether people know their schedule two weeks ahead, whether they had training in the past year, whether they get as much say as they want in adopting new technology. Putting questions like these into a culture survey or employee experience survey makes it clearer what to change when a score comes back low. We cover how to turn survey results into causes and actions in our guide to interpreting culture survey results. And the finding that respect, safety, and supervisor treatment were most closely tied to intent to leave is a reason to revisit how managers are evaluated and developed.
Whether a company is a good place to work is ultimately confirmed by the conditions its people experience. Two years of Gallup data show that when those conditions are broken into five questions, large differences between employees come into view, and those differences carry through to whether people are still there a year later.
Related Reading
- Culture Survey Results: Why “Communication Is the Problem” Changes Nothing
- Culture and Leadership Assessments: What to Do After the Results Arrive
- Why a Leader’s Warm Smile Can’t Create Psychological Safety in the AI Era
References
- Gallup · The American Job Quality Study: 2026 State of the U.S. Labor Force · overview and results pp. 4–13, turnover and health pp. 16–20, mistreatment pp. 21–25, AI pp. 26–29, methodology and dimension criteria pp. 31–36
- Gallup · American Job Quality Study overview
- Hankyung Business · Survey of 3,000 job seekers and employees: what makes a good workplace? · July 4, 2024 · Saramin survey (in Korean)
Related Articles


